20 Oct 2026
Missouri Commercial Casinos Report $165.1 Million Revenue for September 2026

Missouri’s commercial casinos recorded total revenue of $165.1 million during September 2026 according to official regulatory data and this amount reflects a 5.5 percent rise compared with the same month one year earlier. The numbers originate from monthly performance filings that track every licensed property across the state adn they cover all gaming activities including slots, table games and sports wagering where applicable.
Observers note that these figures arrive each month through standardized reporting channels managed by state oversight bodies so the data remains consistent and verifiable. Revenue totals combine win from all machines and tables after payouts while excluding certain promotional credits and the process allows direct year-over-year comparisons without adjustment for inflation or other variables.
Breakdown of Reported Performance
Statewide totals aggregate results from multiple properties yet each casino submits individual statements that regulators compile into the single monthly release. Slots typically account for the largest share of revenue in Missouri markets while table games contribute the remainder and any sports betting operations add their own component when those products operate at the venues.
The 5.5 percent increase translates into roughly $8.7 million more than September 2025 and this growth appears across several properties rather than concentrating at one location. Regulatory summaries do not isolate single-site results in the headline release but they do confirm that the overall movement stayed positive throughout the reporting period.
Context From Regulatory Sources
September 2026 data reached public view through standard channels in early October and this timing follows the usual schedule where casinos submit raw numbers by the tenth of the following month. Analysts who review these releases on a regular basis point to the consistency of the methodology which has remained unchanged for several years allowing clean comparisons across multiple reporting cycles.
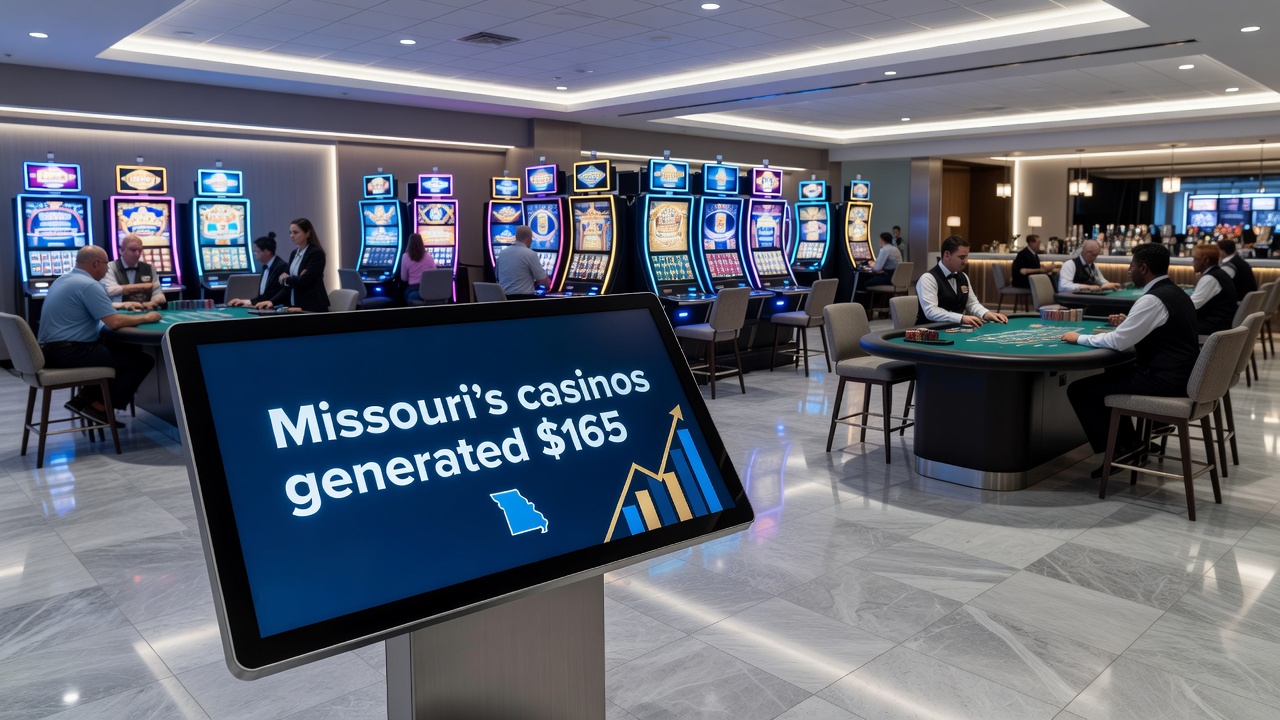
Those who track the industry observe that September often serves as a transitional month after summer peaks and before holiday surges yet the 2026 reading still exceeded the prior year. The regulatory body publishes both aggregate and property-level tables so stakeholders can examine trends at individual venues while the headline figure of $165.1 million captures the complete commercial market.
Year-over-Year Comparison Details
September 2025 closed at approximately $156.4 million so the difference lands at $8.7 million and this margin represents the 5.5 percent gain cited in the official summary. Because the calculation uses identical reporting categories and the same set of operating properties the percentage change stays straightforward and free of seasonal weighting adjustments.
Revenue streams within the total include gross gaming revenue from electronic gaming devices, live table games and any approved sports wagering windows that function inside the casino footprint. Each category contributes according to its own performance patterns yet the combined result produces the single statewide number released each month.
Accessing the Official Data
Monthly reports become available through the Missouri Gaming Commission website shortly after compilation and the September 2026 edition follows the same format used in previous periods. Readers can locate the full spreadsheet that lists property-by-property results along with the aggregate total and the year-over-year percentage change appears in the summary narrative that accompanies the tables.
Additional context sometimes appears in footnotes that explain any one-time events such as temporary closures or equipment upgrades though no such notes altered the September 2026 headline figure. The commission maintains an archive of prior months so anyone reviewing trends can pull multiple reports without difficulty.
Conclusion
The September 2026 revenue report establishes that Missouri commercial casinos reached $165.1 million with a documented 5.5 percent increase over the prior year. This single data point derives directly from regulatory filings that compile every licensed venue’s performance into one statewide total. Observers who follow these releases on a recurring basis recognize the value of the consistent methodology that supports reliable comparisons across months and years. The October publication of these numbers continues the established pattern of transparent monthly disclosure that keeps the commercial casino sector accountable to both regulators and the public.